

Ethereum (ETH) has remained trapped in a tight trading range between $4,200 and $4,500 for the past two weeks, raising concerns among traders that a deeper correction could be on the horizon. Weak demand, declining spot volumes, and continued institutional outflows have fueled bearish sentiment, with some analysts eyeing a potential drop toward $3,500 before any meaningful recovery.
Spot and Institutional Demand Weakens
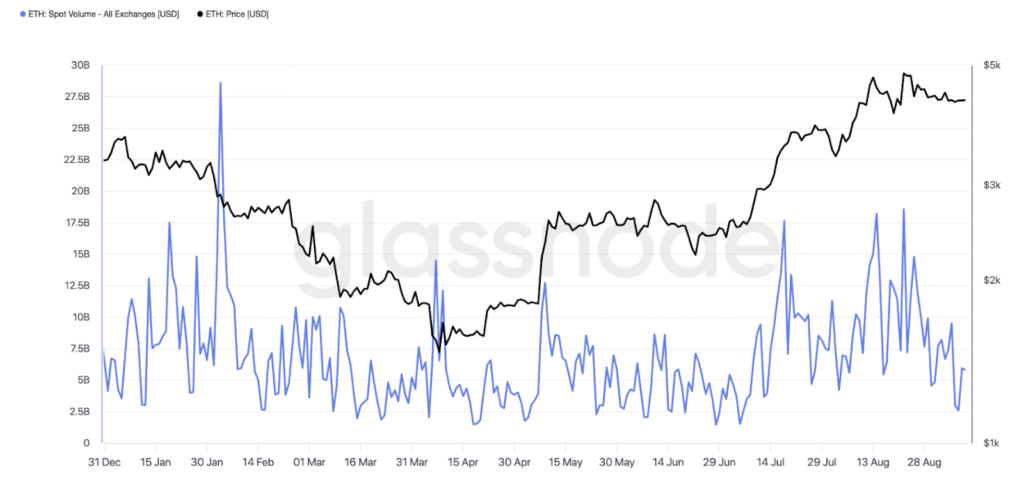
Data from Glassnode shows that Ethereum’s spot trading volume has dropped sharply, falling from $18.5 billion on August 22 to just $2.6 billion by September 8, an 85% decline. This steep fall in volume suggests that investors are stepping back, signaling a lack of conviction in ETH’s near-term price action.
Similarly, cumulative volume delta (CVD), which tracks the net difference between buying and selling volumes, has improved slightly as selling eased. However, it remains significantly below late-August levels, pointing to fragile demand.
Adding to the pressure, institutional appetite for Ethereum appears to be fading. Spot Ethereum ETFs have recorded over $1.04 billion in net outflows across six consecutive trading days, amplifying the bearish outlook.
Market Sentiment Turns Bearish
The weakness in ETH has coincided with a broader downturn in market sentiment. Crypto intelligence firm Santiment reported that traders have increasingly shifted toward “sell calls” following Bitcoin’s recent dip below $100,000. Mentions of terms like “selling” and “bearish” have surged since late August, when Ethereum hit its all-time high of $4,950.
“Traders have changed their tunes, swinging more and more negatively with expectations of Bitcoin falling back below $100K, Ethereum back below $3.5K,” Santiment noted in a recent post.
While such negativity often sets the stage for a contrarian bounce, analysts warn that Ethereum could first see a liquidity sweep before any reversal takes shape.
Key Levels to Watch
Ethereum is currently retesting the lower trendline of a symmetrical triangle pattern at around $4,280. A daily close below this level could open the door for further downside, potentially pushing ETH toward $3,600, about a 16% decline from current prices.
Michael van de Poppe, founder of MN Capital, sees $3,500–$3,800 as a key demand zone where Ethereum could bottom out before resuming an upward trend. Similarly, analyst Ted Pillows highlighted large liquidity clusters between $3,600 and $4,000, suggesting ETH may dip into these levels before a reversal.
If ETH fails to hold the $4,000 support, another area to watch for a rebound is around $3,745. On the flip side, if bulls manage to defend the current range and reclaim higher volumes, Ethereum could avoid a deeper correction and potentially set the stage for renewed upside momentum.
Ethereum’s price action remains fragile as weak demand, ETF outflows, and negative sentiment weigh on the market. While a drop toward $3,500 appears increasingly possible, history shows markets often move against the crowd. A decisive bounce from lower liquidity zones could catch bears off guard and reignite bullish momentum heading into the final quarter of 2025.