

Ethereum’s native token, Ether (ETH), could be gearing up for a significant rally against Bitcoin (BTC), with technical indicators suggesting a potential 75% upside before the New Year. At the time of writing, ETH trades near $4,527, while BTC sits at $116,509, yet chart patterns hint that Ethereum may soon reclaim ground against the market’s largest cryptocurrency.
Inverse Head-and-Shoulders Signals Breakout Potential
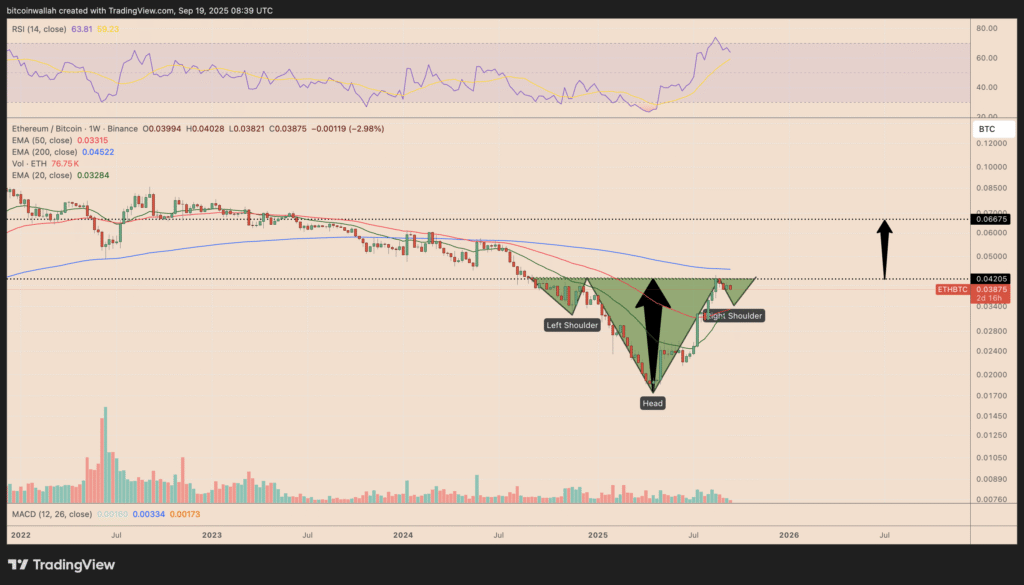
The ETH/BTC trading pair has been carving out what analysts identify as an inverse head-and-shoulders (IH&S) pattern since early September. This setup, often seen as a strong bullish reversal signal, features three troughs, with the middle one forming the deepest point. The neckline resistance currently lies at 0.0420 BTC.
According to technical analysis principles, a confirmed breakout above this neckline could propel ETH/BTC toward 0.066 BTC, representing a surge of roughly 75% from its current levels. Such a move would mark one of the strongest performances for Ether against Bitcoin in years.
Golden Cross Adds Momentum
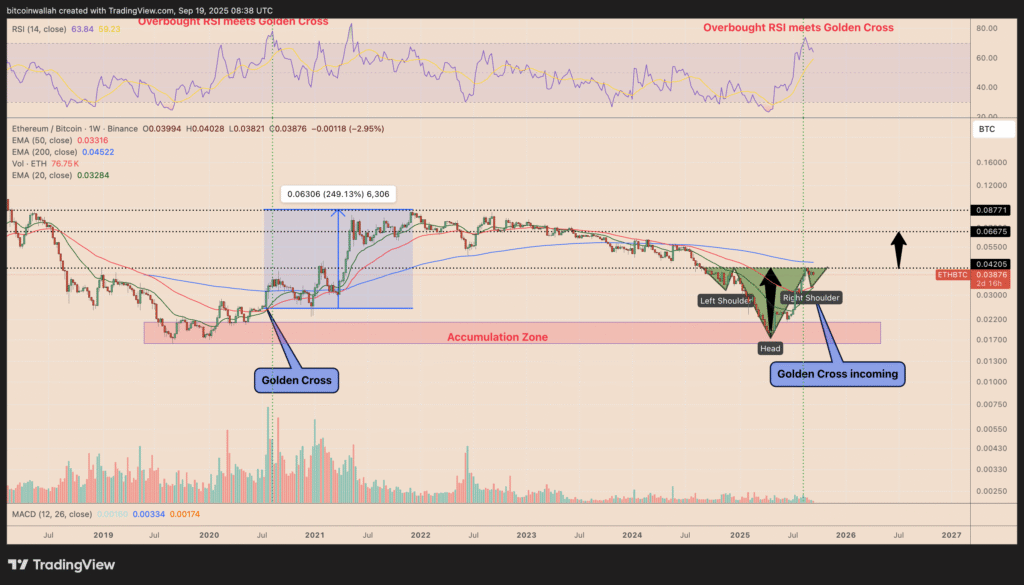
Supporting the bullish outlook is the imminent golden cross formation between Ethereum’s 20-week exponential moving average (EMA) and the 50-week EMA. Historically, this crossover has preceded major rallies. For instance, a similar pattern in July 2020 set the stage for a 250% climb in ETH/BTC.
While traders may see minor pullbacks along the way, particularly in the 0.033–0.045 BTC support range, this area coincides with the two EMAs and could act as a springboard for renewed upward momentum. Analysts believe such a retest would only strengthen the case for a breakout, solidifying Ether’s bullish trajectory.
Key Resistance Levels Ahead
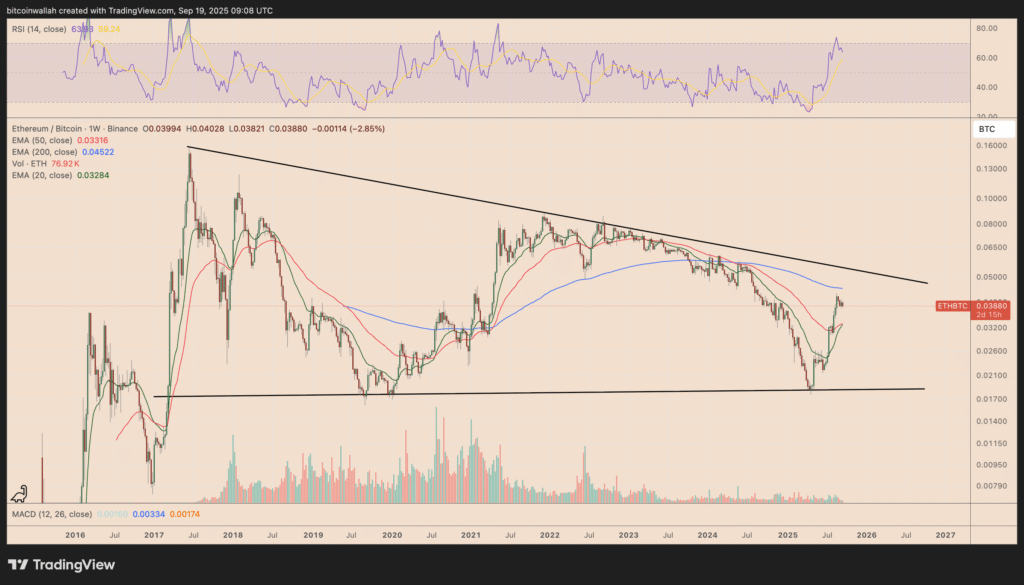
Despite the promising signals, Ether faces crucial hurdles before confirming the full bullish reversal. The first major resistance sits at the 200-week EMA, near 0.045 BTC, a level that has consistently repelled upside attempts for the past two years.
Beyond that lies an even more formidable barrier: a long-term descending trendline that has capped ETH’s rallies against BTC since 2017. This trendline, currently in the 0.050–0.055 BTC range, represents the ultimate test for bulls. Successfully closing above this zone would not only validate the IH&S breakout but could also set the stage for sustained outperformance into 2026.
Ethereum’s technical landscape suggests that it may be on the verge of a major reversal against Bitcoin, with a potential 75% rally if bullish signals play out. The convergence of the IH&S pattern, golden cross setup, and historical precedent point toward a promising end of the year for ETH holders. However, overcoming multi-year resistance levels remains key to unlocking the full upside.