

Ethereum (ETH) traded around $4,300 over the weekend, down just over 2%, but beneath the short-term volatility, strong signals are emerging that suggest the bulls may soon regain control. Backed by significant institutional inflows and continued whale accumulation, ETH’s outlook is strengthening, even as technical resistance levels remain in focus.
Institutional Inflows Bolster Confidence
Ethereum’s resilience has been underpinned by roughly $450 million in ETF inflows, led by major players like BlackRock. These inflows not only demonstrate confidence from long-term investors but also place ETH firmly within mainstream portfolios, signaling that institutions view it as a key asset rather than a speculative trade.
This institutional participation provides stability and depth to Ethereum’s market, reducing the likelihood of extreme downside moves. Moreover, ETF inflows often create a ripple effect, drawing in retail investors who view institutional adoption as validation of ETH’s long-term potential. The combination of institutional capital and retail enthusiasm forms a powerful base that could support a sustainable rally once ETH clears near-term resistance.
Whale Accumulation Suggests Upside Potential
Alongside institutions, whales, large holders of Ethereum, have been steadily accumulating during recent dips. Historically, whale activity has often preceded meaningful price recoveries, as these investors tend to position themselves ahead of retail traders.
Even with ETH slipping more than 2% this week, the consistent accumulation suggests confidence in Ethereum’s medium- to long-term trajectory. For retail and institutional investors alike, this pattern serves as a bullish signal: the so-called “smart money” expects Ethereum to eventually overcome its barriers and push higher.
Ethereum Price Prediction: Technical Outlook
From a technical perspective, Ethereum is currently navigating a descending triangle pattern. The price has repeatedly tested the $4,250 support level, while struggling to break through resistance around $4,490. This tightening range often precedes a decisive breakout.
The 50-day SMA at $4,370 is providing immediate resistance, while the 200-day SMA at $3,872 anchors the broader uptrend. Candlestick patterns such as Doji and spinning tops highlight hesitation, but the RSI at 44 shows a subtle bullish divergence, pointing toward ongoing accumulation.
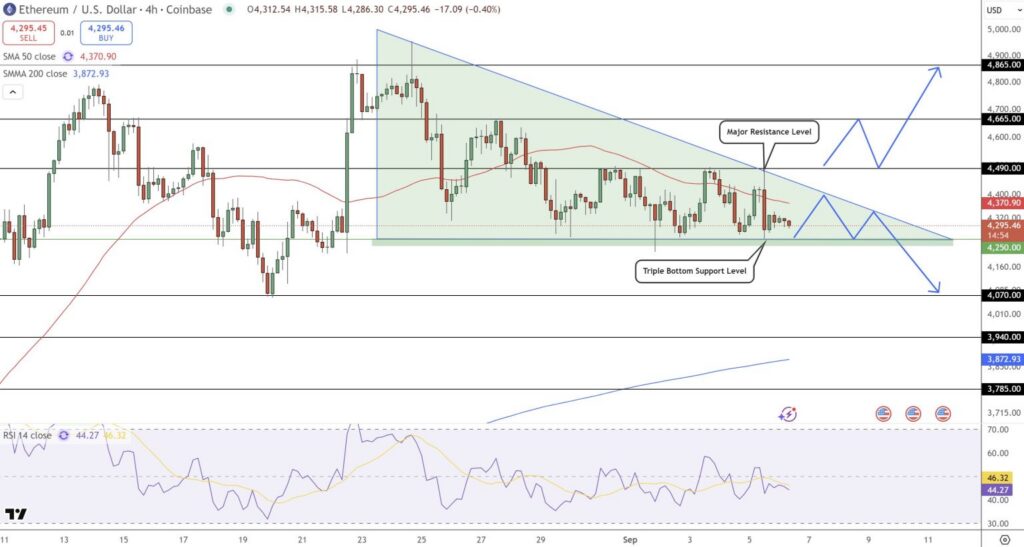
A confirmed breakout above $4,490 could open the path toward $4,665 and $4,865, completing the bullish structure. Conversely, failure to hold $4,250 risks a decline toward $4,070 and $3,940, with the 200-SMA offering final support near $3,872.
For traders, the key is confirmation: a bullish engulfing candle with volume would validate a breakout, while bearish patterns near support could signal caution.
Ethereum’s immediate future hinges on its ability to break above the $4,490 resistance zone. Institutional demand and whale accumulation are firmly supportive, laying the groundwork for a potential bullish reversal. If ETH clears its current barriers, it could mirror Bitcoin’s earlier breakout, setting the stage for a larger rally that reaffirms Ethereum’s status as the leading smart contract platform in the digital economy.