

LINK is showing signs of renewed bullish momentum as adoption metrics surge and technical setups hint at a potential breakout. On October 1, 2025, the network added 1,963 new addresses, the largest daily spike in over a month, highlighting increased participation and user adoption.
This surge coincides with ongoing CCIP integrations, Data Streams expansion, and institutional pilots from Swift and UBS Asset Management, positioning LINK for short- to medium-term upside.
On-Chain Adoption Drives Optimism
The addition of nearly 2,000 new addresses marks a significant uptick compared to September’s daily range of 1,100–1,700 addresses. On-chain data providers like Glassnode view this growth as a leading indicator for demand, often preceding extended price rallies.
LINK’s price responded positively to the adoption surge, rebounding to $22.59 after testing key support near $20.24, which aligns with the 0.786 Fibonacci retracement level. This correlation between network growth and price suggests that heightened activity is translating into tangible buying interest.
Technical Setup: Falling Wedge Signals Potential Breakout
On the 12-hour chart, LINK is forming a falling wedge pattern, a classic setup signaling weakening selling pressure and potential accumulation. A sustained breakout above the $22 resistance could pave the way for a measured move toward $30, representing roughly 38% upside from current levels. Traders are advised to monitor volume confirmation, as rising trading volume is essential to validate the breakout and reduce the risk of a false move.
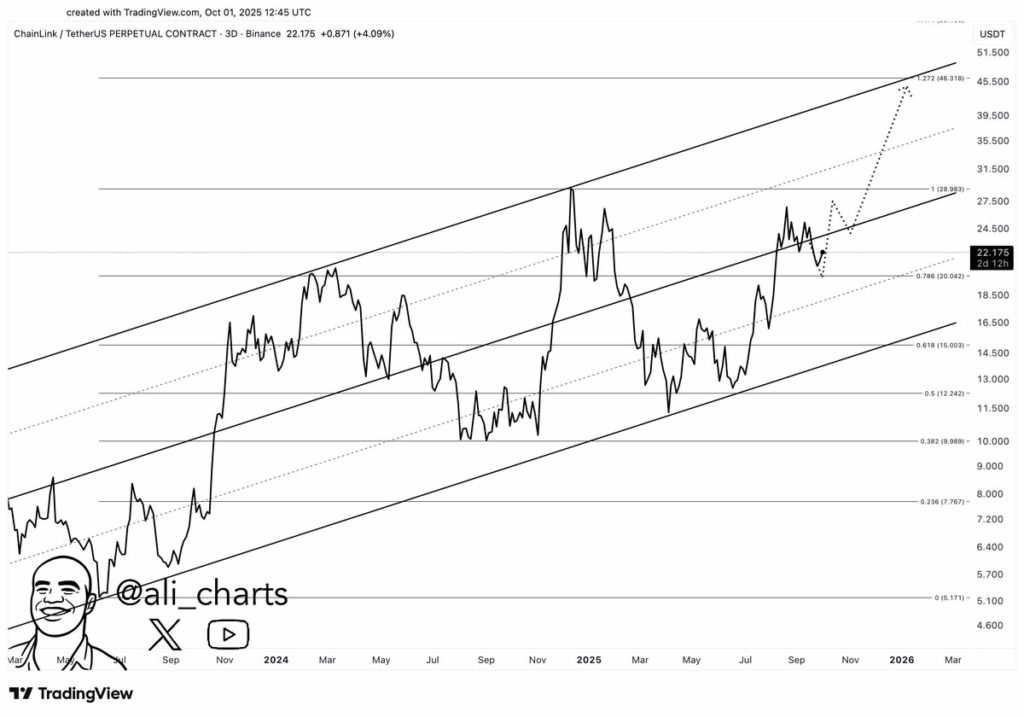
The technical landscape shows LINK holding its key support levels while testing the upper trendline of the wedge. Confirmation of the breakout would open intermediate targets at $23–$24, followed by $28.98, $35–$39, and a full extension to $46.31. Conversely, failure to hold support could see LINK revisit $20–$20.24, with lower accumulation zones around $19–$18.50.
CCIP Integrations and Institutional Pilots Bolster Fundamentals
Beyond technicals, fundamental drivers strengthen the bullish thesis for LINK. CCIP (Cross-Chain Interoperability Protocol), Data Streams, and the Cross-Chain Token standard enable secure cross-chain transfers and real-time data feeds, increasing utility for developers and end users alike.
Early integrations with projects like Worldcoin demonstrate practical applications, while institutional pilots at Sibos showcase real-world enterprise adoption. These developments not only validate Chainlink’s utility but also signal growing acceptance among institutional players, further supporting price momentum.
Key Takeaways for Traders
- Falling Wedge Pattern: Indicates potential bullish reversal if LINK closes above $22.
- Breakout Confirmation: Rising volume and follow-through candles are crucial to reduce false-break risk.
- Technical Targets: Immediate breakout zone at $23–$24, with potential upside toward $30, $35–$39, and full extension at $46.31.
- Fundamentals: CCIP, Data Streams, and institutional pilots provide long-term adoption support.
- Risk Management: Place stops below recent swing lows and size positions to account for volatility.
Chainlink’s combination of strong on-chain growth, institutional adoption, and a promising falling wedge pattern sets the stage for a potential breakout. Traders should prioritize confirmation above $22 with volume validation, while monitoring ongoing adoption metrics for further bullish signals. With fundamentals and technicals aligned, LINK could see a move toward $30 and beyond, offering a compelling risk-reward setup for both short-term traders and long-term holders.